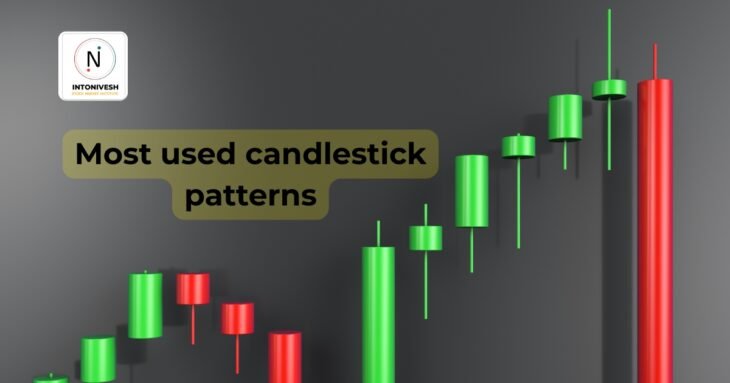
When it comes to chart analysis, candlesticks remain one of the most powerful tools for traders worldwide. Understanding the most used candlestick patterns helps in identifying opportunities, managing risk, and improving clarity in decision-making. In this guide, we’ll walk through candlestick pattern examples, explain their meaning, and explore why they are trusted so widely.
1. Why Candlestick Patterns Are Popular Among Traders
One of the main reasons popular candlestick patterns are studied is because they tell a story about buyers and sellers. Unlike plain line charts, candles reveal the psychology of price action—who is dominating the market. For beginners, a candlestick patterns guide is like learning a new language that translates charts into clear signals.
2. Anatomy of a Candlestick: Body, Wick, and Shadow
Before diving deeper, it’s important to know the parts of a candlestick.
- Body: shows the difference between open and close.
- Wick/Shadow: shows the high and low.
This structure makes it possible to identify the meaning behind candlestick patterns and helps in chart basics. Without this foundation, patterns lose their significance.
3. Bullish Candlestick Patterns Explained
Hammer Candlestick
The hammer candlestick meaning is clear: sellers pushed price down, but buyers fought back and closed near the top. It often signals a potential reversal.
Bullish Engulfing Pattern
A bullish engulfing pattern happens when a large candle completely covers the previous one. It shows buyer strength and is one of the most trusted reversal candlestick patterns.
Morning Star Pattern
This three-candle pattern suggests a transition from selling pressure to buying momentum. It’s among the bullish candlestick patterns explained in every beginner’s guide.
4. Bearish Candlestick Patterns to Watch Out For
Shooting Star
The opposite of a hammer, the shooting star signals weakness. A small body with a long upper wick indicates sellers are overpowering.
Bearish Engulfing
Just like the bullish version, the bearish engulfing pattern shows strong selling pressure. It’s widely studied in the bearish candlestick patterns list.
Evening Star Pattern
Often seen at market tops, the evening star candlestick pattern indicates a reversal of upward momentum.

5. Neutral & Indecision Patterns: The Doji Family
The doji candlestick pattern significance lies in its ability to highlight indecision. Open and close prices are almost the same.
- Standard Doji → Confusion between buyers and sellers.
- Dragonfly Doji → Signals possible bullish reversal.
- Gravestone Doji → Suggests bearish dominance.
Knowing the different types of doji candlestick helps avoid false signals.
6. Reversal vs Continuation: Understanding the Context
Not every candlestick marks a reversal. Sometimes, patterns indicate continuation. For example:
- A bullish flag candle within an uptrend signals continuation.
- A hammer at support may suggest reversal.
That’s why price action with candlesticks and overall context is key. Confirmation ensures you don’t misinterpret the chart.
7. Candlestick Patterns with Volume: Why Confirmation Matters
Volume acts as the backbone of chart analysis. A candlestick pattern confirmation with volume separates strong signals from weak ones. Many beginners face losses due to candlestick pattern mistakes, such as ignoring volume or trading without confluence.
8. Regional Perspective: Popular Candlestick Patterns in Indian Markets
In India, candlestick patterns are actively used in NSE and BSE analysis. For example:
- Engulfing patterns are common in volatile midcap stocks.
- Doji and hammer patterns often appear in highly traded banking stocks.
This makes candlestick patterns India stock market relevant for both retail and institutional traders.
9. Limitations of Relying Only on Candlestick Patterns
While candles provide valuable insights, relying solely on them is risky. They work best when combined with chart patterns, support/resistance, and moving averages. Without context, even the best candlestick patterns can fail. This is why experts often say candlestick signals are reliable but not foolproof.
Final Words: Building Discipline with Candlestick Patterns
Candlestick charts remain one of the most trusted tools in technical analysis. From bullish engulfing to doji patterns, each candle tells a story of market psychology. The real edge lies in combining candlestick chart patterns for beginners with discipline, patience, and confirmation through volume.
By understanding these most used candlestick patterns, you’re not just learning shapes—you’re building the skill of reading price action, which can provide clarity and confidence in your chart journey.